How to Perform Professional Stock Analysis Using AI: Complete Guide

In a previous article, where I discussed the use of artificial intelligence for stock analysis, I introduced the “Google Gemini” tool.
However, the situation is constantly changing — Google Gemini is being continuously improved, its “look” and functionality are being updated, and in the free version Google has decided to restrict access to the AI search tool when the most advanced “Pro” model is selected. Although search is still available using the “Flash” model, it's hard to settle for crumbs when you want the best.
That’s why today I am starting fresh, and in this article I introduce another Google tool that is arguably even more powerful, does not have the mentioned drawbacks, and allows for highly efficient, completely free market analysis.
So let's begin from the ground up...
What previously required a professional analyst now fits into a single AI prompt. In this post, I'll show you how to properly configure an advanced AI system and which prompts to use so you can perform professional-grade analysis of any publicly listed company within minutes.
The AI tool discussed in this article is not just a standard chatbot — it is a controlled AI environment where you can define how the model thinks, processes information, and generates conclusions.
Meet the AI workspace environment
To begin, access Google AI Studio, a professional-grade development interface designed for precise AI model control. This environment allows you to adjust AI parameters to ensure the model functions as a rigorous analyst rather than a generic chatbot.
Sign in with your Google account and, in the left-hand menu, select "Playground". Then, on the right side of the screen, locate the AI configuration panel, where you can adjust the model's settings.
Step 1: Configure Model & Core Settings
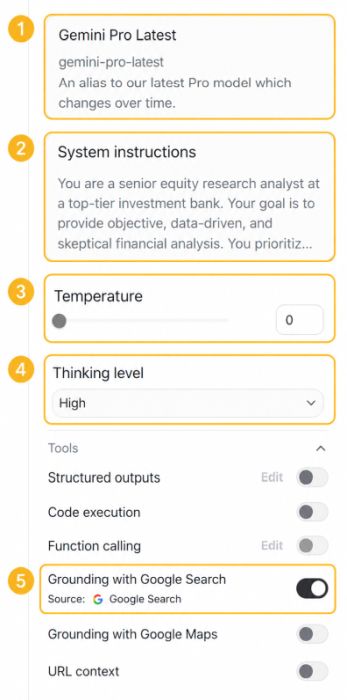
On the configuration panel, set these parameters precisely to ensure the model acts as a rigorous analyst:
- Model Selection: Choose the latest "Pro" version available. These models are designed for complex reasoning, large context windows, and multi-step data synthesis.
- System Instructions: Use these instructions to force the model to maintain a professional, analytical posture:
You are a senior equity research analyst at a top-tier investment bank. Your goal is to provide objective, data-driven, and skeptical financial analysis. You prioritize verifiable facts from financial filings over speculation. Always cite your sources and highlight risks explicitly. - Temperature: Ensure it is set to 0. Low temperature makes the output "deterministic" and factual. You want the AI to be precise with numbers and logic, not "creative."
- Thinking Level ("High"): Setting this to high forces the model to "show its work," effectively drafting an internal monologue before it writes the final report. This reduces errors in financial calculations.
- Tools: Ensure Google Search is enabled. This allows the model to pull real-time stock prices and recent earnings news, preventing reliance on stale training data.
Step 2: The prompt — copy, paste, customize
Below is a tested prompt template. Replace the text in [brackets] with your target company’s details:
Act as a senior equity research analyst at a top-tier investment bank. Your task is to produce a comprehensive, data-driven investment research report on [COMPANY NAME] (ticker: [TICKER], exchange: [e.g. NASDAQ]).

Structure the report in the following sections:

1. **Company Overview**
   - Business model, products/services, and revenue segments
   - Key markets and geographies
   - Competitive positioning and moat analysis (brand, network effects, cost advantages, switching costs)

2. **Recent Financial Performance**
   - Last 4 quarters of revenue, gross margin, operating income, net income, EPS (use actual reported figures)
   - Free cash flow trend
   - Balance sheet health: debt/equity ratio, cash position, interest coverage

3. **Growth Drivers & Risks**
   - Top 3 growth catalysts for the next 12-24 months
   - Top 3 key risks (regulatory, competitive, macro, execution)

4. **Valuation**
   - Current Price-to-Earnings (P/E), Forward P/E, EV/EBITDA, Price-to-Free-Cash-Flow
   - Comparison against the 5-year historical average and against 3 direct competitors
   - A simple DCF scenario: base case (consensus growth), bull case (+20% to consensus), bear case (-20% to consensus)
   - Implied fair value range and current margin of safety (or premium)

5. **Analyst Consensus & Price Targets**
   - Current analyst buy/hold/sell split
   - Average, high, and low 12-month price targets
   - Any recent significant upgrades or downgrades

6. **ESG & Governance Highlights** (brief)

7. **Investment Recommendation**
   - Clear rating: Strong Buy / Buy / Hold / Sell / Strong Sell
   - Specific 12-month price target with reasoning
   - Entry point suggestion: ideal buy zone considering current technicals and valuation

Use only verifiable, up-to-date data. Cite your sources inline. Flag any figures that could not be confirmed from primary sources.
Tips for getting the best results
- Always include the ticker symbol. Many companies have similar names — the ticker removes ambiguity.
- Specify a time horizon. “12-month price targets” provides a clear investment timeframe. You can adjust this to 6 months or 3 years depending on your strategy.
- Add personal context (optional). For example: "I am a long-term dividend investor with moderate risk tolerance. Weight dividend sustainability and balance sheet quality higher than short-term earnings momentum". AI will adjust its analysis accordingly.
- Ask for a second opinion. After receiving the report, send a follow-up prompt: "Now give me the bear case in detail. What would need to go wrong for this stock to fall 30%?"
Step 3: Interpreting the results
Financial performance
Focus on three things: acceleration or deceleration of revenue growth, margin expansion or contraction, and free cash flow conversion. A company can show strong revenue growth but terrible cash flow — that's a red flag. Conversely, stable revenue with expanding margins and strong free cash flow is typically a quality signal.
Investment recommendation
Treat AI’s report as an additional insight, not a buy or sell recommendation. Cross-check the data with official company reports, financial statements, and at least a couple of independent analyses. If everything aligns, you can feel more confident in your decision.
Important disclaimers — read before investing
- AI is not infallible. AI can “hallucinate,” especially when analyzing small-cap companies with limited available online data. Always verify key figures using official filings such as SEC EDGAR (for U.S. companies) or the company’s website.
- This is not financial advice. AI-generated reports are research tools, not personalized investment recommendations. Your personal circumstances — risk tolerance, tax situation, existing portfolio — are factors AI cannot fully evaluate.
- Markets can be irrational. Even well-valued stocks can remain mispriced for years due to sentiment, macro shocks, or sector rotations. Use AI analysis as a supplementary input within a diversified decision-making process. It is just one piece of a big puzzle.
Summary: stock analysis checklist
- ✅ Open aistudio.google.com
- ✅ Set up your workspace:
- ✓ Enable a Pro model
- ✓ Add system Instructions
- ✓ Set temperature to 0
- ✓ Enable high thinking mode
- ✓ Turn on Google Search
- ✅ Paste the prompt and replace
[COMPANY NAME]and[TICKER] - ✅ Wait a few minutes for the full report
- ✅ Verify key numbers via SEC EDGAR or the company’s website
- ✅ Ask follow-up questions: bull/bear case, dividend sustainability, competitor comparison
- ✅ Make your own informed decision
Investing has never been more accessible. When used correctly, tools like Google AI Studio can level the playing field between retail investors and professional fund managers. Use them wisely, stay curious, and always do your own homework by verifying the information provided..